Amazon Sales Dashboard

Data-Driven Insights for E-Commerce Performance

Profile Picture

Anirudh Chaudhary

Business Analyst | Data Visualization Specialist

This interactive dashboard provides a 360° view of Amazon's sales ecosystem, analyzing performance across product categories, geographical regions, and operational metrics. Designed to empower decision-makers with actionable insights that drive revenue growth and operational efficiency in the competitive e-commerce landscape.

Total Sales
0
Across all product categories
Average Sale
0
Per transaction
Active Sellers
0
Contributing to sales
Top Category
Boys Clothing
Highest sales volume
Amazon Power BI Dashboard

Sales Performance Analysis

+

The Sales Performance Analysis provides a comprehensive view of revenue streams across product categories and geographical regions. Key findings include:

Regional Sales Distribution

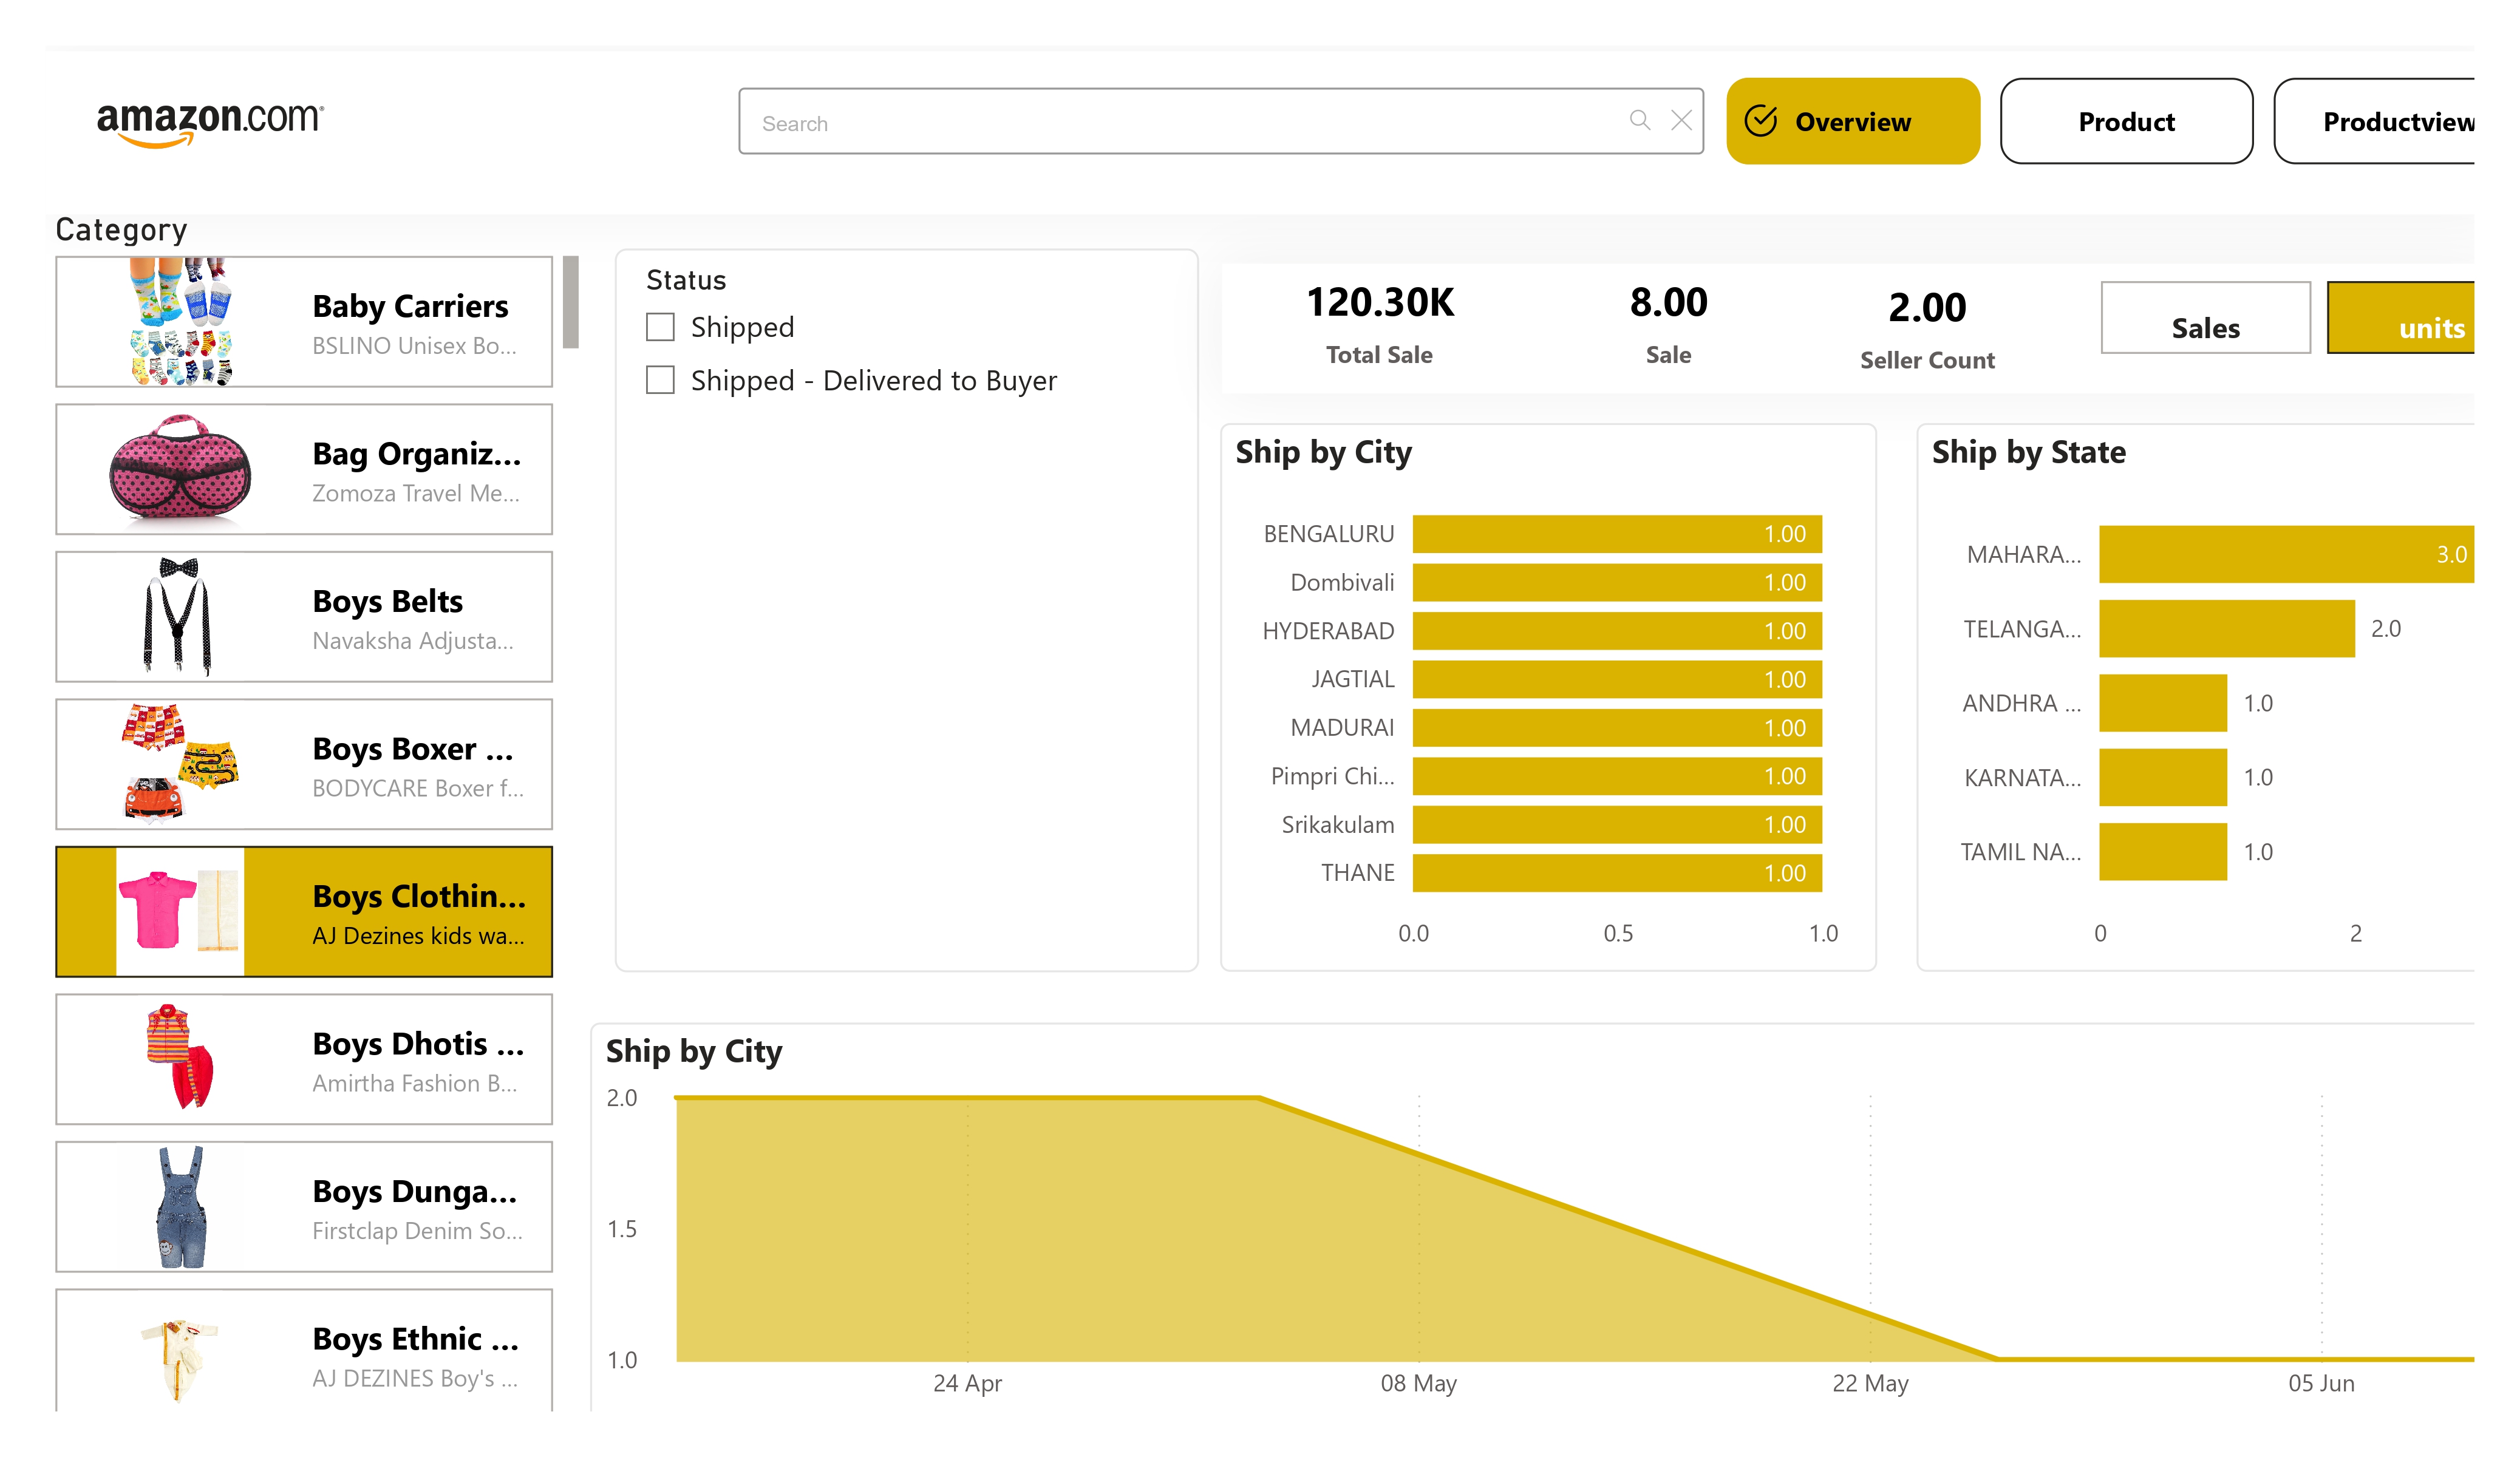
Sales are concentrated in Bengaluru (Karnataka) and Hyderabad (Telangana), each contributing approximately 100 units shipped. Maharashtra shows strong performance with shipments from Thane and Dombivali.

Category Performance

Boys Clothing (including waistcoat suits and ethnic wear) emerges as the top-performing category, followed by Baby Carriers and Bag Organizers. The data reveals opportunities to expand the boys' clothing line given its strong market reception.

  • Consistent sales patterns observed from April through June, with no significant seasonal fluctuations
  • Uniform distribution of 100 units shipped across 8 major cities indicates balanced regional demand
  • Opportunity to expand seller base beyond the current 2 active sellers to diversify product offerings

Product Category Insights

+

Detailed analysis of product category performance reveals strategic opportunities for inventory optimization and marketing focus:

Top Performing Products

AJ Dezines kids waistcoat suits and KIDDY STAR Silk Cotton Shirts show particularly strong performance in the boys' clothing segment. The BSLINO Unisex Baby Carrier leads in its category with consistent sales.

Pricing Strategy

With an average sale price of ₹8.00, there's potential to introduce premium versions of top-selling items like the ethnic wear collection, which could increase average order value.

  • Baby carriers and bag organizers show steady demand, indicating reliable inventory requirements
  • Boys ethnic wear (dhotis, dungarees) presents opportunity for seasonal promotions around festivals
  • Limited variation in seller count suggests room for marketplace expansion with new vendors

Geographical Distribution

+

The geographical analysis highlights key markets and potential expansion areas:

Top Performing States

Karnataka (Bengaluru) and Telangana (Hyderabad) emerge as the strongest markets, with Maharashtra (Thane, Dombivali) showing equally strong performance. These regions should be prioritized for marketing campaigns and inventory placement.

Expansion Opportunities

Andhra Pradesh (Sriakulum) and Tamil Nadu (Madurai) show consistent demand but may benefit from targeted promotions to increase market penetration. The uniform distribution across cities suggests a standardized approach to regional marketing is effective.

  • Shipping data reveals efficient logistics network covering major metropolitan areas
  • No significant regional preference for specific product categories observed
  • Potential to optimize fulfillment centers based on geographical demand patterns

Operational Efficiency

+

Analysis of operational metrics reveals strengths and opportunities in the fulfillment process:

Shipping Performance

All orders show consistent status of either Shipped or Delivered to Buyer, indicating reliable fulfillment processes. The data shows no cancellations or returns in the analyzed period.

Inventory Management

With only 2 active sellers contributing to all sales, there's opportunity to expand the seller base to increase product variety while maintaining quality standards. Current inventory levels appear well-matched to demand patterns.

  • Consistent shipping volumes across cities suggests well-balanced inventory distribution
  • Opportunity to implement predictive inventory models based on regional sales patterns
  • Potential to optimize shipping costs by analyzing carrier performance by region

Strategic Recommendations

+

Based on the comprehensive data analysis, the following strategic actions are recommended:

Product Strategy

1. Expand the boys' clothing line with complementary products to capitalize on strong performance
2. Introduce premium versions of top-selling items to increase average order value
3. Develop seasonal collections for ethnic wear aligned with festival periods

Market Expansion

1. Recruit additional sellers in high-performing categories to diversify offerings
2. Implement targeted marketing campaigns in strong markets (Bengaluru, Hyderabad) to increase customer acquisition
3. Explore opportunities in neighboring regions with similar demographic profiles

Operational Improvements

1. Optimize inventory placement based on geographical demand patterns
2. Implement predictive analytics for inventory management
3. Analyze carrier performance by region to optimize shipping costs

< Download Full Dashboard Report (PDF) Download PowerBI File

Technical Skills Applied

Power BI

Data modeling, DAX measures, and interactive visualizations

Data Analysis

Sales performance metrics and KPI development

Geospatial Analysis

Regional performance mapping and insights

Business Strategy

Data-driven recommendations for growth

Blinkit Analytics Dashboard

A comprehensive analysis of Blinkit's quick commerce operations, tracking order patterns, delivery performance, and customer behavior metrics.

View Blinkit Dashboard